Splunk .conf26: Letting the Agentic SOC Handle the Drudgery So the Humans Can Dig Deeper

Original Entry by : Elliott Hinson

By Elliott Hinson, Integrations Engineer, Endace


Elliot Hinsen, Integrations Engineer, EndaceWorking at the Agentic Security Operations Center (SOC) for Splunk .conf26 was a very exciting experience. The strangest part was that I did not spend most of my time doing any of the Tier 1 style SOC analyst work. Sure, there were tickets to close, a few devices trying to phone home to any TOR exit node they could reach, some interesting alerts related to gaming software installed on corporate devices that should not have anything like that, and many other discoveries that my colleagues and I had to take care of.

But the most interesting part to me was the time made available, now that the bulk of the drudge work was offloaded to AI agents. By the time you managed to look at an incident ticket the agent had already done a bunch of data collection that you would have had to do manually, so all we really had to do was assess the evidence provided, make a judgement call on how to proceed, and get back to doing anything more interesting than basic or repetitive triage.

Why be a Tier 1 analyst when you can be a Tier 3 threat hunter?

So, we had all this free time now, how did we spend it? The Event Agentic SOC has three objectives: Protect, Educate, and Innovate. The Educate part was being taken care of by the 30-plus SOC tours that were going on, and now that the agents were making the Protect part of the job less time-consuming, there was plenty of time for us to focus on Innovate during the conference.

The team at work at Splunk .conf26

One innovation I had the most fun working on was the newly added JA3/4+ style traffic fingerprinting. For readers not familiar with the SOC architecture, I will skip most of it and focus on the parts that matter for JA3/4+ style scanning. The SOC at Splunk .conf26 had three main components that enabled our network fingerprinting innovation work. First, was the incoming SPAN port that mirrored all of the conference traffic, from every subnet and access point, into a single fiber that came into the SOC. This was a twin set of 10Gbit links that pumped terabytes of data into the second of the three core components of the SOC: two EndaceProbe packet capture appliances. These EndaceProbes recorded every single packet that traversed the network from the moment the SPAN was turned on until we shut them down when the conference ended.

The EndaceProbes not only provide massive high-speed storage capacity, and multiple packet capture interfaces, they also support integration with a whole suite of 3rd-party monitoring solutions, and enough onboard compute power and Application Dock™ hosting capacity (think virtual machines) to host a wide range of network monitoring security software, from Snort, to Zeek, to Suricata, and more.

At Splunk .conf26 we thought “why choose between Zeek and Suricata when we can run both”? With both tools generating massive volumes of log data, it all has to go somewhere. Where should it go? If only there was a vendor with robust enough log ingestion systems to keep up with the network speeds our EndaceProbes can operate at? If only there was a vendor with a trusted, reliable search and query system that could sift through massive volumes of logging data to provide a budding threat hunter with all of the intel they needed to really see the big picture?

Oh wait… this is Splunk .conf and Splunk Enterprise Security is the platform!

Splunk + Endace: pairing the wine with the cheese

Splunk and Endace are uniquely synergistic. Splunk searches and bubbles up logs and alerts, and with the Endace Pivot2Vision integration, you can go from the searchability of Splunk logs to the authority and clarity of Endace packets with a single click.  While we were tuning the SOC during setup, we took the approach of “turn every single bit of logging and scanning on that we can and separate the signal from the noise later”. After all, Endace was reading every packet, and it could turn that into logs, detections, etc. And Splunk is well known for being able to drink from the firehose. Plus, how often do you get a Splunk Cloud instance with essentially a blank check on how much data you can push into it? So, we opened up the fire hose and let Splunk drink up, and oh boy did it.  Splunk has a very rich search and dashboarding interface and a powerful query language that can tear through log data at ridiculous speeds. However, dumping every single bit of data you can get out of your firewall or IDS system into Splunk is both computationally and financially wasteful. That is why it is so important to tune your logs so that you are ingesting useful stuff and skipping the noise.

With the Endace hardware the economics are reversed. You buy an EndaceProbe, put it in your network, and let it fill up with as much packet data as it can hold. It becomes an exercise of “I paid for the whole hard drive, I’m going to use the whole hard drive”. And while EndaceProbes can hold massive pools of packet data and can filter down that data to what you are looking for with the EndaceVision web interface, it can’t hold a candle to the immense power of the Splunk query language. Need to find all the traffic coming from a single IP? EndaceVision. Need to see a specific IP conversation between two hosts? EndaceVision again. Need to look at the exact contents of a specific TCP session that happened 3 days ago? Those EndaceProbes won’t even break a sweat. Need to do a complex query involving multiple lookups, regex across several plain text fields, generating custom columns that are calculated by generating a risk score based on an amalgamation of other plain text fields? That is squarely a Splunk job.

But what if you are looking for something that wouldn’t generate an alert? Not something dangerous, just something odd. Well, that line of questioning leads right into the new traffic fingerprinting work we implemented during this conference.

JA3? JA4? NPF? Whose fingerprints are these?

We just established that it doesn’t make sense to load raw packet data into Splunk. EndaceProbes provide amazingly quick search and data mining of packet data across terabytes of packet data – for both human and AI agents. What they don’t provide is the broader capability that Splunk offers to query across multiple telemetry sources and run complex queries. But, when we pair them, we get an amazing combination that lets us see the 30,000 foot view, and quickly correlate data, as well as being able to dive right down to definitive packet level evidence to understand individual sessions and packet sequences.

An example of the power of combining the full packet recording capability of EndaceProbes with the powerful search, querying and data correlation capability of Splunk, is using EndaceProbes to generate fingerprints from encrypted traffic sessions. You can then configure your Splunk instance to ingest these fingerprint logs so that you can do connection level analysis without having to have all the connection data itself loaded into Splunk.

 Framework  

 Best At                                                                                  

 JA3        

 Fingerprinting TLS clients using a simple, widely adopted hash.                          

 JA4        

 Correlating client behavior across multiple protocols and network layers.                

 Mercury NPF

 Identifying devices and applications from encrypted traffic using rich protocol metadata.

We ended up going with the JA4+ series of fingerprints because it offered more detection versatility than the older JA3 series of fingerprints. We didn’t employ Cisco’s Mercury NPF to analyze encrypted traffic because there was already an existing Cisco encrypted traffic analysis engine running in the SOC as part of Cisco Secure Firewall Firepower Threat Defense Encrypted Visibility Engine. So, it did not make sense to duplicate this. However, we could have used Mercury NPF via a Zeek plugin if that had not been already available to us.

What is JA4+ fingerprinting?

The list below shows various JA4 style fingerprinting styles. The key takeaway is that different types of fingerprints reveal different types of information about the data traversing the network. 

Fingerprinting data can be generated continuously, as traffic is recorded on EndaceProbes, and sent to Splunk where it provides very useful insight into encrypted traffic sessions. Generating this data continuously – rather than relying on a trigger to detect suspected malicious activity and then send a log to Splunk – means you (and your agentic tools) always have the fingerprint data at hand when it’s needed, even when there was no triggered detection. As we’ll see below, this can enable you to do detections and investigations that you might not have initially envisaged would be useful.

 Fingerprint 

 Protocol / Layer      

 Purpose                                                                                                                    

JA4

 TLS Client            

 Identifies client applications and TLS libraries based on ClientHello characteristics.                                     

JA      

 TLS Server            

 Fingerprints TLS server responses and server-side TLS implementations.                                                     

JA4H

 HTTP                  

 Identifies browsers, applications, and tools based on HTTP request behavior and headers.                                   

JA4L

 Network Latency       

 Estimates network distance and latency characteristics between hosts.                                                      

JA4LS

 Network Latency Server

 Server-side counterpart to JA4L for latency and path analysis.                                                             

JA

 X.509 Certificates    

 Fingerprints certificate generation patterns to identify common tooling, infrastructure, or certificate issuance behaviors.

JA4SSH

 SSH                   

 Identifies SSH clients, servers, and automation frameworks from SSH negotiation behavior.                                  

JA4

 TCP                   

 Fingerprints TCP/IP stack behavior for operating system and networking stack identification.                               

JA4TS

 TCP Server            

 Server-side TCP stack fingerprinting.                                                                                      

JA4TScan

 TCP Scanning          

 Provides TCP fingerprints useful for identifying and classifying scanned hosts and services.                               

JA4

 DHCP                  

 Identifies devices and operating systems from DHCP request characteristics.                                                 

JA4D6

 DHCPv6                

 IPv6 version of DHCP fingerprinting for device identification.                                                             

Now that is a long table! We are going to specifically focus on the JA4SSH fingerprints for brevity, but you can imagine all the fun ways in which you could combine and cross reference these fingerprints to find interesting outliers or even build detections.

A JA4SSH fingerprint looks like this: `c64s64_c31s149_c64s0` which may look like just a string of letters and numbers, but there is actually a lot of information here. Each of the segments delineated by the underscore describes a different SSH behavior that was detected on the wire. `c64s64` is a description of the client and server payload sizes, `c31s149` is the description of the Packet counts and `c64s0` is a description of the ACK behavior.  If we decode these a little further into a nice table, we can start to see a clearer pattern.

 Metric        

 Value

 Client payload

64

 Server payload

64

 Client packets

31

 Server packets

149

 Client ACKs   

64

 Server ACKs   

0

You can deduce from the balanced size of payloads and the relatively balanced and low size of packets that this is an interactive session. If we saw a lot of unbalanced payload sizes or packet counts, we might suspect that this was a bulk download of some kind, perhaps using something like SCP. 

Now suppose we wanted to detect bulk downloads or uploads, and possibly even filter for a specific IP address that might be important on the network? For example, probably no one should be SSHing into the firewall and uploading or downloading large quantities of data. The best part about having fingerprint data available is that with a very small amount of context describing the syntax for these network fingerprinting technologies, the Agentic SOC can pick up on this and use it to find outliers that it would not have thought to look for before.

For example, below is an image of an agent generated Splunk query, searching for any large bulk downloads or uploads:

Agent-generated Splunk query to search for large bulk uploads or downloads.

With a short description of how the fingerprints we had in place could be broken up, the agent could ascertain several instances of large SSH traffic sessions and categorize them by what is probably happening inside that SSH tunnel – using heuristics that would normally not have been available without the fingerprinting data.

It’s always good to double-check your AI’s work! Using the EndaceVision web GUI, we can easily go back and review the SSH traffic from that period… I wonder when this bulk download happened?

Using EndaceVision to analyze the selected traffic.

What started as a strange-looking JA4SSH fingerprint turned into a hypothesis. The fingerprint suggested behavior more consistent with a bulk transfer than an interactive shell. A quick Splunk search surfaced the candidate traffic. A single Pivot-to-Vision click later, and we were looking at the packet capture that explained exactly what happened. For the curious, the first two spikes in the graph above were a vulnerability demo put on at Splunk .conf26 for training, and the second two large spikes were a user uploading a large amount of encrypted data to a cloud VPS.

This sequence of events is what I found most interesting about working in the Agentic SOC. None of this investigation started with an alert. Nobody woke up that morning wondering what the JA4SSH fingerprints of the conference network looked like. There wasn’t a ticket demanding that the work be completed by the end of the shift. This was curiosity-driven threat hunting enabled by the fact that the repetitive work had already been handled for us.

The agents were closing the loop on the obvious incidents. They were gathering enrichment data. They were collecting context. They were doing the sort of repetitive investigative tasks that traditionally consume the bulk of a Tier 1 analyst’s day. And because of that, analysts were free to spend time asking questions that normally fall into the category of “that would be nice to investigate if I ever had a spare afternoon.”

It turns out, when you free up analysts’ time and give them a chance to dig deeper, spare afternoons can turn into innovations that provide interesting (and useful) results.

Acknowledgements

Our thanks go to the Splunk .conf26 SOC team, led by Jessica Oppenheimer,  for the opportunity to integrate EndaceProbes with the Splunk .conf26 Agentic SOC architecture. 

The SOC team is a collection of Cisco, Splunk and Endace experts across many domains who were a pleasure to work and innovate with, and we came away with a great appreciation for the power of the Cisco and Splunk tools.

The teams were able to prove out integration innovations and test them in earnest in a real-world environment in preparation for making them generally available to the market.

More from Endace, Splunk and Cisco in the SOC series

Read all about the Agentic Security Operations Center at Splunk .conf26, including an overview from Jessica Oppenheimer, and posts and use cases from Splunk and Cisco SOC team members:

Read about the Endace team’s experience working in the SOC at Splunk .conf26:

For more Endace blogs in our SOC series, see here:
https://blog.endace.com/tag/soc/ 

Cisco Event SOC Website 
Visit Cisco’s Event SOC website for full details of the SOC-in-a-Box setup, and download the detailed architecture blueprint and report by Jessica Oppenheimer:
https://www.cisco.com/site/us/en/products/security/event-soc-report.html


Splunk .conf26: Richer Data for the Agentic SOC

Original Entry by : Andreas Löf

By Andreas Löf, Software Manager, Endace


Dr. Andreas Löf, Software Manager, EndaceEndace supported Splunk in two different ways in the Agentic Security Operations Center (SOC) at Splunk .conf26. Firstly, capturing and recording every packet transmitted across the Spunk .conf network to create a source of ground truth so all events can be verified. Secondly, creating rich metadata ingested by Splunk and used for detection and investigation in the Agentic SOC.

During Splunk.conf26 we expanded on the data the EndaceProbe Appliances delivered to Splunk by enabling full Suricata detections and expanding the pre-existing Zeek detections we had from previous events.

These expanded rulesets allowed us to cross-correlate events between Zeek, Suricata, and Cisco Secure Firewall Threat Intelligence. Each one of these sources provides a part of the picture. Correlating them gave us better quality detections and enabled more robust investigations. EndaceVision™️ and embedded Wireshark™️ then provided the ability to evaluate findings by analyzing the actual packet evidence.

Real-world Investigation Scenario

During .conf26, there was an analyst’s queue in Splunk Enterprise Security (ES) of alerts that had been generated. The AI agents would then investigate the different events, classify them, and suggest further steps for the analysts to follow up for the event.

At .conf26, the AI agent flagged and investigated multiple instances of hosts connecting to a specific external IP address that was deemed potentially risky. We verified the agent’s findings and discovered the hosts were connecting to Baidu, often known as the Google of China. As .conf26 is attended by people from all over the world, there’s nothing inherently risky with visitors connecting to Baidu. As a part of the investigation, we verified that the connections came only from hosts on the attendee network – no instances originated from conference infrastructure – and that there was no sign of C2 traffic. We also confirmed the IP address was genuinely registered to Baidu and wasn’t spoofing a Baidu host.

Further examination of the traffic showed us there were a multitude of hosts connecting to the IP address flagged by the AI agent. Analyzing all the related traffic on the EndaceProbe showed that it was genuine traffic, primarily encrypted.

Analyzing the suspicious traffic in EndaceVision


The EndaceProbes were also able to identify most of the traffic in the above screenshot as Baidu traffic, through detection rules built into the EndaceProbe’s Deep Packet Inspection (DPI) engine.

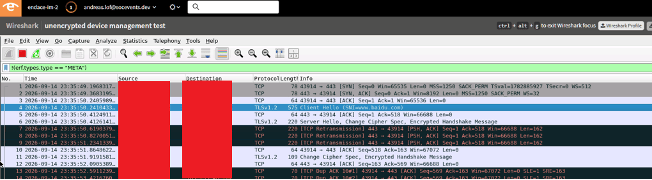
We then further verified the traffic by looking at the raw packets in Wireshark, where we could see that the traffic was to a server presenting itself as baidu.com, as can be seen from the Wireshark screenshot below.

Inspecting the traffic using embedded Wireshark hosted on the EndaceProbes

This then allowed us to confidently move the investigation back into Splunk and look at all alerts that had been generated around these systems. We verified that all the events were going to eitherwww[.]baidu.com or sp1[.]baidu.com./

Checking all www.baidu.com alerts in Splunk


Checking all sp1.baidu.com alerts in Splunk

We could then confidently close these events as false positives, having verified the premise that the traffic was benign in nature.

Richer Data – More Certainty

During the preparation phase of the Agentic SOC for .conf26 we enabled more metadata collectors running on the hosted DockOS VMs on the EndaceProbes. These ran both Suricata™ and Zeek™ and performed deep packet inspection of all network traffic, without any interruptions to the capture and recording.

Comparing Zeek and Suricata shows that they have a different detection and reporting rate when operating across the same traffic.

System

Event Findings

Suricata

208

Zeek

461

Further investigation into the specific events (TLS inspection) shows that Zeek uncovered more events and more hosts than Suricata. However, they are different types of systems and detect different things.

This highlights the usefulness of running both systems in tandem and processing the same data. This generates richer metadata for both AI Agents and Humans to investigate and react to, as well as more detections. By correlating events across multiple sources, we get stronger evidence as to whether the event is a true positive, or a false positive. We can also more easily determine whether it is benign.

Detection Tuning

Over 30 minutes, Suricata generated 5.3 million events and Zeek about 3.1 million. For both systems, this excluded the stats reporting.

Suricata

Suricata was configured to capture traffic from eight Endace Virtual Data Acquisition and Generation (DAG) cards that received a flow-coherent, balanced traffic stream from the EndaceProbe hosting the virtual machine on which the system was running.

The events were configured to be logged into eve.json, which was then ingested into Splunk via the Splunk Log Forwarder. The logs were aggressively rotated after ingestion to manage disk space.

We enabled the open Emerging Threats rule set (approximately 55k rules) as well as most of the protocol dissectors. There’s overlap with the configuration we applied to Zeek, but the example above shows a difference in the system’s effectiveness, which makes the overlap valuable.

Zeek

Like Suricata, Zeek was also configured to capture network traffic from eight Endace Virtual DAG cards with the same setup as for Suricata.

Unlike Suricata, Zeek typically writes output from each analyzer to a separate log file. The Splunk Log Forwarder ingested these files, and they were then rotated to conserve disk space. Again, like Suricata, we enabled most of the dissectors. In addition to the protocol dissections, we had the Endace custom file extraction code and sample uploader enabled. Extracted uploaded files were then analyzed and used to generate events for any suspicious files.

Conclusions

Endace DockOS provides the ability to run both Suricata and Zeek in tandem and ingest exactly the same set of data. Both systems have some overlapping functionality but are fundamentally different in their use cases and types of alerting.

Suricata is rule and alert-based, designed to fill a role similar to Snort. Zeek, on the other hand, is designed to analyze the network traffic and generate rich metadata from it.

There is some overlap in the data Zeek and Suricate can provide, but there are also large areas where each system can create an alert/event that the other does not. We can also observe how the event rates differ from the same traffic across Suricata and Zeek. By running both systems in tandem and feeding them the same traffic from our EndaceProbes we get a better overview of the network activity, and we can pivot back to the raw packets where necessary to confirm findings or do more in-depth investigation.

As discussed in The Zero-Day Blind Spot: Why Your Agentic SOC needs Retrospective Packet Replay, it’s also possible to replay existing traffic against new detection rules to validate whether any systems have been affected by a zero-day attack. That can be extremely useful to determine whether a successful attack took place (and you have been impacted and need to respond) or, conversely, prove that no successful attacks happened.

Preparing for the next Agentic SOC

During .conf26 the human analysts made a great amount of use of the expanded event logs from Suricata and Zeek to validate AI agent investigations. In future SOCs we are looking to expand on the AI agent capabilities and the base events to make greater use of event correlation, when possible, to provide a stronger evidence chain for investigations.

This will allow AI agents to draw conclusions more quickly and easily when investigating events, and human analysts to more quickly and easily validate an AI agent’s conclusions.

Making Zeek and Suricata evidence available alongside Splunk Events gives both human analysts and AI agents much greater certainty for fast investigation and effective response. While both tools provide some common data, together they offer a very rich set of evidence, with the ability to pivot to Endace’s full packet data when needed, that gives both AI agents and human analysts deep visibility into all network activity, backed by primary, definitive, packet evidence.

Acknowledgements

Our thanks go to the Splunk .conf26 SOC team, led by Jessica Oppenheimer,  for the opportunity to integrate EndaceProbes with the Splunk .conf26 Agentic SOC architecture. 

The SOC team is a collection of Cisco, Splunk and Endace experts across many domains who were a pleasure to work and innovate with, and we came away with a great appreciation for the power of the Cisco and Splunk tools.

The teams were able to prove out integration innovations and test them in earnest in a real-world environment in preparation for making them generally available to the market.

More from Endace, Splunk and Cisco in the SOC series

Read all about the Agentic Security Operations Center at Splunk .conf26, including an overview from Jessica Oppenheimer, and posts and use cases from Splunk and Cisco SOC team members:

Read about the Endace team’s experience working in the SOC at Splunk .conf26:

For more Endace blogs in our SOC series, see here:
https://blog.endace.com/tag/soc/ 

Cisco Event SOC Website 
Visit Cisco’s Event SOC website for full details of the SOC-in-a-Box setup, and download the detailed architecture blueprint and report by Jessica Oppenheimer:
https://www.cisco.com/site/us/en/products/security/event-soc-report.html

Splunk .conf26: Why Endace Full Packet Capture Becomes Mission-Critical in the Agentic SOC

Original Entry by : Michael Morris

By Michael Morris, Director of Global Business Development, Endace


Michael Morris, Director of Global Business Development, EndaceWhy Full Packet Capture Matters More as AI Becomes a Security Analyst

The security industry is entering a new operational era. For years, Security Operation Center (SOC) modernization focused on improving detection. Better analytics. Better threat intelligence. Better correlation. More automation. Today, the focus has shifted.

The emergence of Agentic SOC architectures is changing the fundamental question from: “Can we detect threats?” to “Can we trust the conclusions generated by autonomous investigations?“

As AI agents take on larger portions of triage, enrichment, evidence gathering, and investigation, one reality becomes increasingly apparent: The success of the Agentic SOC is not determined by AI alone. It is determined by the quality of evidence available to AI.

At Splunk .conf26, Endace demonstrated why full packet capture is rapidly becoming one of the most important sources of evidence in modern security operations.

Security Teams Have Solved the Visibility Problem

For most organizations, the lack of data is no longer the problem. SOCs are flooded with telemetry:

  • Security logs
  • DNS activity
  • Endpoint events
  • Firewall records
  • NetFlow
  • Application telemetry
  • Identity data
  • Threat intelligence feeds
  • Cloud activity

The challenge today is not collecting data. The challenge is determining which data is trustworthy enough to support increasingly autonomous security decisions. As investigations become more automated, the distinction between telemetry and evidence becomes critical. Telemetry tells you something happened. Evidence tells you exactly what happened. That distinction separates packet capture from virtually every other data source in the SOC.

The Agentic SOC Needs Ground Truth

One of the most important architectural principles emerging from modern security operations is the concept of ground truth.


AI systems consume evidence. They assess confidence. They eliminate noise. They prioritize risk. They recommend actions. But every recommendation ultimately depends on the underlying data. If the evidence is incomplete, conclusions become uncertain. If the evidence is delayed, investigations slow down. If the evidence is ambiguous, analysts lose confidence.

Full packet capture solves this problem by preserving the original network conversation. Instead of relying solely on summaries, metadata, or derived analytics, analysts and AI agents can continuously return to the authoritative source. In a world increasingly driven by machine reasoning, packet capture provides something rare: A verifiable record of reality.

Splunk .conf26 Demonstrated the Scale of the Challenge

The event network operated at a scale that most enterprise security teams would recognize immediately.

Endace captured:

  • 30 TB of packet data
  • 31.6 billion packets
  • 154.7 million unique sessions
  • 9,443 unique clients

Beyond pure scale, packet analysis revealed operational insights that would have been difficult to uncover through logs alone:

  • 111,062 files extracted
  • 5,839 files submitted for advanced analysis
  • 3,589 plaintext password sightings
  • 83 unique accounts transmitting credentials in clear text
Statistics from Splunk .conf26

These are not simply interesting statistics. They illustrate why packet capture remains unique. Every file transfer. Every protocol exchange. Every credential exposure. Every network session. Every byte of communication. All available for validation long after the original event occurred.

Packet Capture Is No Longer a Forensics Tool

Historically, packet capture occupied a specialized role. A major security incident occurred. An analyst opened packet data. Investigators reconstructed what happened. A report was written. The incident was closed. That model no longer reflects how modern SOCs operate. The Agentic SOC requires evidence continuously, not occasionally. Investigations happen in real time. AI agents gather context automatically. Analysts expect immediate answers. Executive stakeholders demand traceable decisions. Packet capture has therefore evolved from a forensic platform into an operational system. Instead of helping explain yesterday’s incident, packet data actively informs today’s decision-making. That shift represents a fundamental change in the value proposition of full packet capture.

The Network Still Tells the Truth

One challenge every security team faces is fragmented visibility. Endpoint data may be unavailable. Cloud telemetry may be incomplete. Third-party systems may lack instrumentation. Logs may be sampled. Alerts may be suppressed. Users may operate devices outside administrative control. The network remains the common denominator. Every system communicates. Every application transmits data. Every attack generates traffic. Every compromise leaves traces. Packet capture therefore provides visibility that does not depend upon deployment models, operating systems, agents, or administrative ownership.

For environments with large populations of unmanaged devices, such as conferences, campuses, hospitals, universities, manufacturing facilities, and guest networks, packet capture is especially valuable because it remains available even when other telemetry sources – such as end point telemetry – are not.

What AI Learns from Packets

Discussions around the use of AI in cybersecurity typically focus on its ability to increase the speed of response. Speed is undeniably important, but the greater value is context.

Full Packet data provides context that is unavailable from any other source of data:
• Complete session reconstruction
• Application behavior
• File movement
• Protocol misuse
• Credential exposure
• The detail of command-and-control communications
• User activity patterns
• Traffic timelines

When these elements are combined with threat intelligence, security analytics, and behavioral detections, AI systems gain access to evidence rather than indicators alone. That changes the quality of investigation outcomes. Instead of reporting: “a suspicious event occurred” the system can determine: “this event occurred, these systems communicated, these files were transferred, this protocol was used, and this is the evidence that supports the conclusion.” The result is not simply faster investigations. The result is more trustworthy investigations.

Building Explainable Security Operations

One of the greatest risks facing security organizations is the emergence of black-box decision making. The more autonomous systems become, the more important explainability becomes.

Security leaders need to know:

  • Why a finding was escalated
  • Why an event was closed
  • Why an investigation was prioritized
  • Why a response action was recommended

Answers require evidence. Evidence requires records. Records require preservation.

That is the role packet capture fulfills. Endace provides the evidentiary foundation that connects AI reasoning, analyst decision-making, and organizational accountability. It allows every conclusion to be traced back to observable network activity.

The Future of the Agentic SOC

Over the next several years, most security operations centers will adopt some level of agentic capability. AI-driven triage will become standard. Autonomous investigations will become common. Machine-generated recommendations will become expected. What will differentiate successful organizations from unsuccessful ones will not be solely the intelligence of the agents. It will be the quality of the evidence available to those agents. The organizations that achieve the greatest value from AI will be those that provide their AI tools with the richest, most complete, and most trustworthy data foundation. That foundation increasingly requires full packet capture.

At Splunk .conf26, Endace demonstrated that packet capture is no longer just about retrospective forensics. It is about enabling trustworthy AI, explainable investigations, and evidence-based security operations. As the industry moves toward the Agentic SOC, one conclusion becomes clear:

AI may become the analyst’s co-pilot, but packet capture remains the system of record.

Acknowledgements

Our thanks go to the Splunk .conf26 SOC team, led by Jessica Oppenheimer,  for the opportunity to integrate EndaceProbes with the Splunk .conf26 Agentic SOC architecture. 

The SOC team is a collection of Cisco, Splunk and Endace experts across many domains who were a pleasure to work and innovate with, and we came away with a great appreciation for the power of the Cisco and Splunk tools.

The teams were able to prove out integration innovations and test them in earnest in a real-world environment in preparation for making them generally available to the market.

More from Endace, Splunk and Cisco in the SOC series

Read all about the Agentic Security Operations Center at Splunk .conf26, including an overview from Jessica Oppenheimer, and posts and use cases from Splunk and Cisco SOC team members:

Read about the Endace team’s experience working in the SOC at Splunk .conf26:

For more Endace blogs in our SOC series, see here:
https://blog.endace.com/tag/soc/ 

Cisco Event SOC Website 
Visit Cisco’s Event SOC website for full details of the SOC-in-a-Box setup, and download the detailed architecture blueprint and report by Jessica Oppenheimer:
https://www.cisco.com/site/us/en/products/security/event-soc-report.html